Visualizations
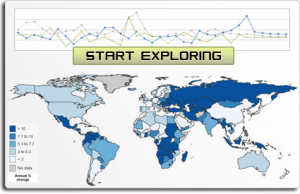
 Selected portions of the datasets have been visualized through the interacting thematic mapping and graphing functionality offered by StatPlanet, a free application created by UNESCO and affiliated organizations.
The following Flash-driven thematic maps are currently available:
2000-2004
Set I |
|
|---|---|
| Population | Total population, population density |
| Fertility | Livebirths by mother’s age, sex ratio of livebirths, total fertility rate |
| Mortality I | Death rate, life expectancy at birth |
| Mortality II | Infant mortality |
| Reproductive Outcomes I | Livebirths by birthweight, livebirths by gestational age |
| Reproductive Outcomes II | Perinatal mortality |
Set II |
|
| Disease Incidence I | Breast, cervical, prostrate cancers |
| Disease Incidence II | Other cancers |
| Disease Incidence III | Tuberculosis |
| Behaviours | Smoking |
| Socioeconomic Conditions | GDP, tertiary educational attainment |
| Physical Environment | Mean temperature |
Note that in these visualizations, the regional rather than national character of the datasets have been stressed.
 About StatPlanet
StatPlanet is a free application for creating thematic maps and graphs. The aim of StatPlanet is to promote evidence-based decision making by improving and facilitating the communication and interpretation of information. It enables users to explore demographic, education, environment, health and socio-economic indicators from various sources including the datasets compiled by the Circumpolar Health Observatory.
StatPlanet was conceptualized and is being developed by Frank van Cappelle since 2005. Since 2008, the development of a tailored version of StatPlanet is being undertaken as part of the SACMEQ research programme at the UNESCO International Institute for Educational Planning (IIEP). For more details, please contact Frank van Cappelle.
